Friday, May 9, 2008

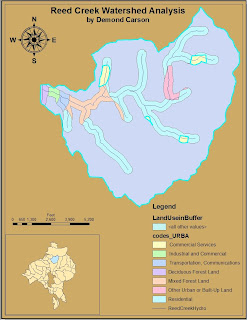
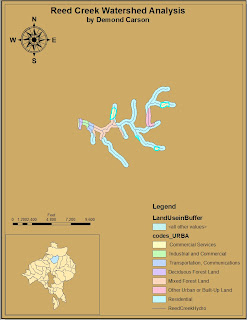
REED CREEK WATERSHED PROJECT


Here is my final project for the Reed Creek Watershed Analysis. At first I had a hard time, but with some help from my friend and teacher Pete "Rafting King" Kennedy, I was able to pull it together. My problem was that I was over analyzing everything. After I learn to calm down and take it slow, things seem to come together. This was my first GIS class and it was different from what I have taken in the past, but I enjoyed every minute of this experience. So to all the people who have take it or not, I believe you will enjoy this class and the teacher. On one more note, if you are curious about the class, try it, you only live once.
Peace

Tuesday, April 22, 2008

GIS 111 WN1 Spatial Analyst/ 3D Analyst


My Images is not in order. Here is the order from top to bottom. The first image is the Contour, the second imageis the Aspect, the third image is the Slope, and the last image is the Elevation with the hillshade. In the exercise I used 40% Transparency on all the different data frames. This was one of my favorite exercises.

Thursday, April 17, 2008

GIS QUIZ MAP RESULTS

This is the final results from a lab quiz on what I've learn so far. I loaded feature classes, select attributes by locations, then turn around and exported the selected features such as parks within 400 feet of the floodplain in the E9 EMS polygon.

GIS 111 SPATIAL ANALYSIS


Here is some examples of spatial analysis maps. I learned to do a lot with the spatial analyst extension, like hillshades, slopes, and a histogram.

Thursday, April 10, 2008

Analyzing Spatial Data


I like Chapter 12 a lot. Using the arcToolBox the Buffer tool was pretty easy. Here is some of my maps I exported.

Thursday, March 13, 2008

GIS 111 Ch 10 Selecting Features by Location


Selecting features by location using spatial relationship can be very helpful. If you wanted to map out an area where shopping malls or gas stations in Asheville NC you could use this to refine your search.

GIS 111 Ch9 Joining and Relating tables


This reminds me of doing database work, where you join related tables with same attribute. I start to understand this a little better.

Wednesday, March 12, 2008

GIS 111 Quering Data and Generating Reports


I like Ch 8 querying data. I learn how to identify different features in neighborhood. Realtors can use this to their advantage. By looking up different property attributes, I was able to generate a report on specific information.

GIS 111 Georeference and Geodatabase


I'm writing about how difficult is to georeference a scanned map. I had got the control points down real well, and when I looked at the link table my RMS error was zero but map didn't even out with the image. Here take a look.

Thursday, February 21, 2008

GIS Chapter 16 Editing Features and Attributes


I like these exercises because I was allowed to delete, move, split and merge features on a copy of a city geodatabase. Here is some features that has been modified.


Thursday, February 14, 2008

GIS 111 Chapter 15 Creating Features


I like the way I use the sketch tool from the editor toolbar to connect water lines that actually are connected in this city subdivision. I can see why you had to digitize these water lines. I guess if something like a new firehydrants was added to a new development, the city would need add it or those to their geodatabase.


Wednesday, February 13, 2008

GIS 111 Chapter 19


This assignment on map designing was a pretty good one.


Tuesday, February 12, 2008

GIS 111 WN1 Chapter 13 Maps


GIS 111 WN1 Chapter 13

I found that chapter 13, Projecting Data in Arc Map pretty interesting. I didn't know that map projections flat's the earth. So I guess from what I read and the exercises I did, using longitude and latitude defines the coordinates on a curve surface. Then when using a map, you would use the X and Y coordinates to define location.

Thursday, January 31, 2008


GIS 111 Chapter 2

I learn that spatial data is often referred to as layers, coverages, or themes. Themes represent, in a special digital storage format, features on, above, or below the surface of the earth. Depending on the type of features they represent, and the purpose to which the data will be applied, themes will be one of 2 major types.

Vector data represent features as discrete points, lines, and polygons.

Raster data represent the landscape as a rectangular matrix of square cells.

Thursday, January 24, 2008

Chapter 3 Maps


Day 1- GIS 111

This class is very interesting

New To Gis

Hey this Demond and I am new to this GIS information systems. I am will to learn what is available in this intro class.